After a backbreaking loss to the Reds on Wednesday, the Mariners head into this huge series against the Rangers still searching for answers to their woes. The trade deadline is quickly approaching and this series in Texas along with next week’s series in Los Angeles against the Dodgers will have a lot of bearing on how the team approaches upgrading the roster. There are clear areas of need on the roster, and the team is firmly in win-now territory, but dropping well below .500 during this road trip should force the team to ask some really tough questions.
|
Game |
Time |
Mariners Starter |
Rangers Starter |
Mariners Win% |
Rangers Win% |
|---|---|---|---|---|---|
|
Game 1 |
Friday, July 24 | 5:05 pm |
RHP Bryce Miller |
LHP MacKenzie Gore |
47.3% |
52.7% |
|
Game 2 |
Saturday, July 25 | 4:15 pm |
RHP Bryan Woo |
RHP Nathan Eovaldi |
50.9% |
49.1% |
|
Game 3 |
Sunday, July 26 | 11:35 am |
RHP Logan Gilbert |
RHP Jacob deGrom |
47.1% |
52.9% |
|
Game 4 |
Monday, July 27 | 11:35 am |
RHP George Kirby |
RHP Kumar Rocker |
52.8% |
47.2% |
|
Overview |
Mariners |
Rangers |
Edge |
|---|---|---|---|
|
Batting (wRC+) |
99 (9th in AL) |
104 (3rd in AL) |
Rangers |
|
Fielding (FRV) |
-26 (14th) |
-9 (11th) |
Rangers |
|
Starting Pitching (FIP-) |
88 (2nd) |
98 (8th) |
Mariners |
|
Bullpen (FIP-) |
92 (5th) |
99 (9th) |
Mariners |
For their part, the Rangers aren’t exactly running away with the AL West right now despite the Mariners’ struggles. Texas lost its series to the White Sox earlier this week and maintains a slim half game lead over Seattle in the division. More importantly, the Rangers lead the season series 4-2; anything more than a split in this series would guarantee they hold the tiebreaker if the division race comes down to the wire in September.
Advertisement
The offensive woes that plagued this roster last year haven’t really improved; they’re 22nd in runs scored this year, same as they were last season. The big difference is that their pitching staff isn’t leading the majors in run prevention, sliding down to 14th thanks to a shakier starting rotation and a poorer bullpen. They finished last year at .500 and they’re sitting at that exact record this season. Nothing has really changed except for the league context around them.
|
Player |
Position |
Bats |
PA |
K% |
BB% |
ISO |
wRC+ |
|---|---|---|---|---|---|---|---|
|
DH |
L |
305 |
23.0% |
11.8% |
0.244 |
130 |
|
|
Wyatt Langford |
LF |
R |
216 |
21.3% |
6.0% |
0.228 |
133 |
|
3B |
R |
396 |
17.9% |
8.3% |
0.147 |
127 |
|
|
Brandon Nimmo |
RF |
L |
409 |
21.5% |
7.8% |
0.163 |
115 |
|
1B |
R |
398 |
26.4% |
7.5% |
0.182 |
100 |
|
|
SS |
R |
349 |
24.1% |
7.4% |
0.167 |
111 |
|
|
CF |
L |
279 |
23.7% |
12.2% |
0.149 |
85 |
|
|
2B |
L |
146 |
14.4% |
2.7% |
0.045 |
101 |
|
|
C |
R |
108 |
19.4% |
1.9% |
0.183 |
88 |
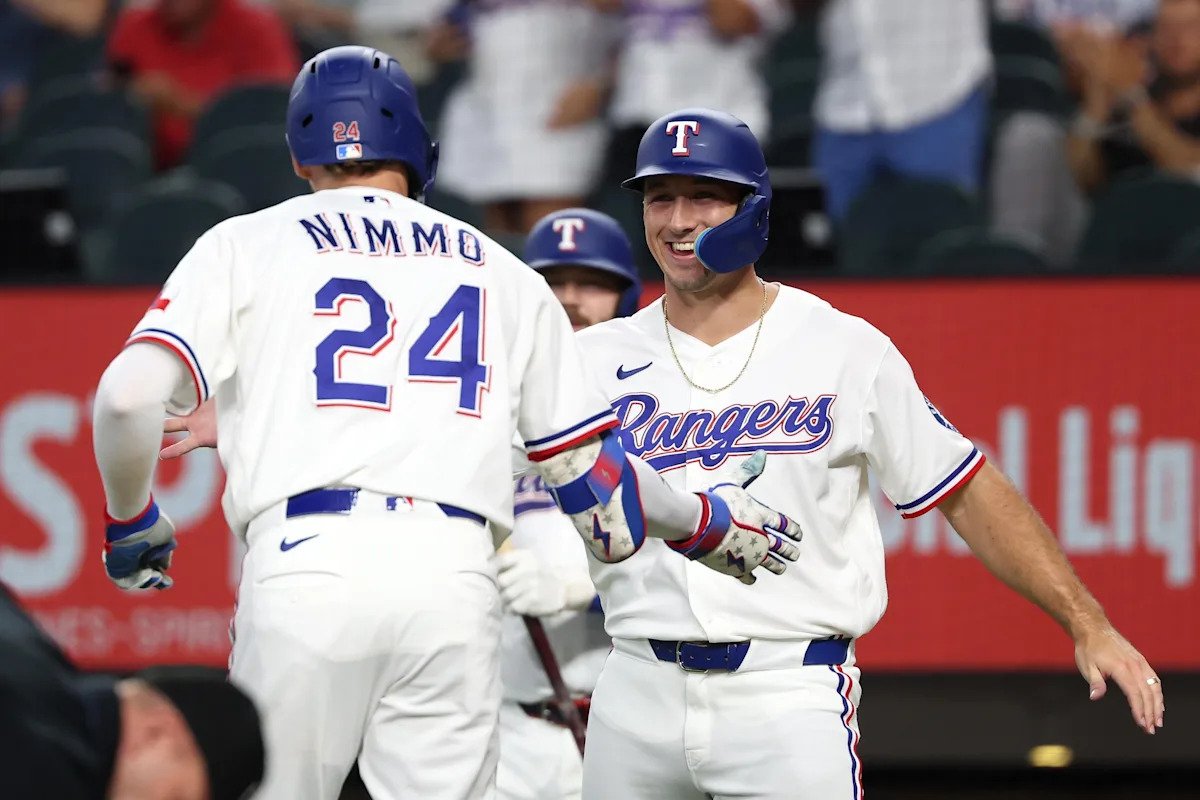
The Rangers have gotten almost nothing out of Corey Seager this year; he’s only played in 51 games, has an 86 wRC+, and is currently on the IL with a recurring back issue. Luckily, Wyatt Langford has stepped up to lead the lineup, though he’s dealt with his own injury issues this year too. The young outfielder is displaying a lot more power even though his contact quality has taken a bit of a step back this year. The Rangers are also enjoying bounce back seasons from Josh Jung and Joc Pederson. The former is finally healthy and has significantly improved his plate discipline and the latter is simply back to crushing right-handed pitching like he has throughout his career.
The back half of the lineup is pretty messy. Ezequiel Duran is doing his best to cover for Seager’s absence and Nicky Lopez and Elias Díaz have been pressed into full-time roles thanks to a number of other injuries.
Probable Pitchers
Advertisement
|
Pitcher |
IP |
K% |
BB% |
HR/FB% |
GB% |
ERA |
FIP |
|---|---|---|---|---|---|---|---|
|
MacKenzie Gore |
110.2 |
25.7% |
8.8% |
11.0% |
37.0% |
4.80 |
3.82 |
|
Bryce Miller |
63.1 |
29.5% |
4.1% |
12.7% |
39.5% |
2.27 |
3.23 |
|
Pitch |
Usage vRHB |
Usage vLHB |
Velocity |
Stuff+ |
Whiff+ |
BIP+ |
xwOBA |
|---|---|---|---|---|---|---|---|
|
Four-seam |
48.1% |
34.6% |
95.4 |
95 |
105 |
95 |
0.307 |
|
Sinker |
1.0% |
18.2% |
95.2 |
102 |
112 |
150 |
0.394 |
|
Cutter |
11.6% |
0.0% |
89.9 |
94 |
112 |
68 |
0.375 |
|
Changeup |
13.9% |
0.0% |
86.7 |
93 |
115 |
50 |
0.172 |
|
Curveball |
25.3% |
6.2% |
81.8 |
108 |
98 |
90 |
0.316 |
|
Slider |
0.1% |
40.9% |
85.7 |
99 |
74 |
126 |
0.290 |
From a previous series preview:
MacKenzie Gore was the Rangers’ big offseason acquisition in January. After being included in the blockbuster Juan Soto trade (the first one from Washington to San Diego), Gore has established himself as a solid frontline starter over the last few years. His secondary weapons are all fantastic — he’s the only pitcher in baseball to feature four pitches with whiff rates north of 35% — but he’s often let down by an inconsistent fastball. When he’s locating his heater well, it can give opposing batters fits. But too often — and particularly during the second half of the season when he’s worn down significantly — his locations will leak into the middle of the zone and batters will punish the pitch.
Gore was pretty solid through the first three months of the season, running a 4.05 ERA and a 3.43 FIP through the end of June. July hasn’t been kind to him, however — he’s allowed 18 runs in 19.2 innings this month — and it looks like he’s about to stumble through another second-half slide like he has every season before this. In his two starts against the Mariners this year, he held them scoreless at home in five innings and then gave up five runs in five innings in Seattle the next time around.
|
Pitcher |
IP |
K% |
BB% |
HR/FB% |
GB% |
ERA |
FIP |
|---|---|---|---|---|---|---|---|
|
Nathan Eovaldi |
115.1 |
25.3% |
5.8% |
20.4% |
49.8% |
4.21 |
4.35 |
|
Bryan Woo |
110.1 |
24.2% |
4.9% |
8.8% |
38.1% |
4.16 |
3.22 |
|
Pitch |
Usage vRHB |
Usage vLHB |
Velocity |
Stuff+ |
Whiff+ |
BIP+ |
xwOBA |
|---|---|---|---|---|---|---|---|
|
Four-seam |
12.9% |
13.6% |
94.6 |
90 |
100 |
100 |
0.424 |
|
Sinker |
17.6% |
0.1% |
93.5 |
101 |
64 |
171 |
0.332 |
|
Cutter |
13.2% |
24.4% |
90.5 |
95 |
120 |
95 |
0.366 |
|
Splitter |
34.0% |
39.7% |
88.5 |
95 |
100 |
91 |
0.274 |
|
Curveball |
22.3% |
22.2% |
76.4 |
101 |
126 |
81 |
0.233 |
From a previous series preview:
Advertisement
Nathan Eovaldi has been forced to figure out how to do more with less (fastball velocity). Last year, he dropped the usage of his four-seam fastball by nearly 15 points, added a sinker to his repertoire, and increased the usage of his cutter and curveball. The result was a pitch mix that was a lot less predictable and a lot less dependent on his deteriorating velocity. Unfortunately, elbow and shoulder injuries derailed the success he was seeing with his new approach, and he spent most of the second half of the season on the shelf.
Eovaldi has dramatically shifted away from his fastball this year, dropping its usage to just 13%. He’s now throwing his splitter and curveball more than half the time, though that shift in pitch mix hasn’t exactly resulted in great topline results. He’s been pretty inconsistent throughout the year despite leaning on his two big swing-and-miss pitches. Previously against the Mariners, he allowed two runs in six innings in Arlington and then four runs in five innings back in Seattle.
|
Pitcher |
IP |
K% |
BB% |
HR/FB% |
GB% |
ERA |
FIP |
|---|---|---|---|---|---|---|---|
|
Jacob deGrom |
105.1 |
30.2% |
5.7% |
13.3% |
35.2% |
3.76 |
3.33 |
|
Logan Gilbert |
120 |
27.3% |
5.3% |
10.9% |
35.8% |
3.38 |
3.33 |
|
Pitch |
Usage vRHB |
Usage vLHB |
Velocity |
Stuff+ |
Whiff+ |
BIP+ |
xwOBA |
|---|---|---|---|---|---|---|---|
|
Four-seam |
40.7% |
43.1% |
97.2 |
107 |
118 |
82 |
0.354 |
|
Sinker |
4.4% |
0.1% |
96.2 |
||||
|
Changeup |
3.1% |
20.7% |
89.8 |
108 |
143 |
72 |
0.222 |
|
Curveball |
3.8% |
8.1% |
80.7 |
104 |
157 |
147 |
0.194 |
|
Slider |
48.0% |
28.0% |
91.1 |
112 |
120 |
101 |
0.253 |
From a previous series preview:
Last year, Jacob deGrom made 30 starts for the first time since 2019 and crossed the 150 IP threshold for just the fifth time in his career. That health was the result of a conscious effort to pitch with a little less intensity. His fastball velocity was down about a tick from where it was at his peak, though it still averaged 97.5 mph. From a results standpoint, he ran his lowest strikeout rate since 2016 and the highest FIP of his career. Even in his diminished form, he was still one of the better pitchers in baseball, and as they say, the best ability is availability.
Advertisement
deGrom has continued to pitch excellently in his age-38 season, and more importantly, he’s stayed mostly healthy. In his two previous starts against the Mariners, he’s allowed a single run across nine innings.
|
Pitcher |
IP |
K% |
BB% |
HR/FB% |
GB% |
ERA |
FIP |
|---|---|---|---|---|---|---|---|
|
Kumar Rocker |
96 |
20.9% |
8.8% |
11.5% |
44.6% |
4.13 |
4.16 |
|
George Kirby |
116 |
21.8% |
5.2% |
9.2% |
47.0% |
3.57 |
3.24 |
|
Pitch |
Usage vRHB |
Usage vLHB |
Velocity |
Stuff+ |
Whiff+ |
BIP+ |
xwOBA |
|---|---|---|---|---|---|---|---|
|
Four-seam |
6.5% |
15.6% |
94.4 |
82 |
111 |
98 |
0.346 |
|
Sinker |
42.1% |
21.4% |
94.3 |
100 |
66 |
121 |
0.399 |
|
Cutter |
13.4% |
16.1% |
90.3 |
83 |
94 |
95 |
0.409 |
|
Changeup |
0.0% |
8.9% |
88.7 |
72 |
|||
|
Slider |
38.0% |
38.0% |
83.2 |
94 |
123 |
111 |
0.209 |
Kumar Rocker has taken a big step forward this year, not because he’s improved his strikeout-to-walk ratio in any meaningful way, but simply because he isn’t allowing as much hard contact. His strikeout-to-walk ratio is essentially unchanged from where it’s been during his first two seasons in the big leagues, but his hard hit and barrel rates allowed have dropped significantly. The biggest change in his profile is a greater emphasis on his death ball slider; he’s throwing it 38% of the time, is running a 41% whiff rate with it, and opposing batters have produced a .211 wOBA against it. His other pitches don’t stand out in any meaningful way, so it really seems like his improvement stems from leaning on his best pitch a lot more often.
The Big Picture:
|
Team |
W-L |
W% |
Games Behind |
Run Diff |
Recent Form |
|---|---|---|---|---|---|
|
Rangers |
51-51 |
0.500 |
— |
-30 |
W-L-L-W-L |
|
Mariners |
51-52 |
0.495 |
0.5 |
+17 |
W-W-W-L-L |
|
Astros |
50-54 |
0.481 |
2.0 |
-45 |
L-L-W-W-W |
|
Athletics |
43-59 |
0.422 |
8.0 |
-122 |
W-L-W-L-L |
|
Angels |
41-62 |
0.398 |
10.5 |
-58 |
L-W-W-W-L |
|
Team |
W-L |
W% |
Games Behind |
Run Diff |
Recent Form |
|---|---|---|---|---|---|
|
57-45 |
0.559 |
+4.5 |
+88 |
L-W-W-L-W |
|
|
Guardians |
54-50 |
0.519 |
+0.5 |
-6 |
L-W-W-L-L |
|
52-49 |
0.515 |
— |
+45 |
W-W-W-W-L |
|
|
Mariners |
51-52 |
0.495 |
2.0 |
+17 |
W-W-W-L-L |
|
Twins |
51-53 |
0.490 |
2.5 |
-30 |
L-L-L-W-W |
The Astros bounced back from being swept last weekend by sweeping the Marlins this week; they’ll head to Chicago to face the White Sox this weekend. We’re fans of the Athletics this weekend as they take on the Twins in Minnesota. The Red Sox finally had their win streak snapped at 15 games on Wednesday, but they’ve opened up a two-game lead in the Wild Card race. Boston hosts the Blue Jays this weekend.

