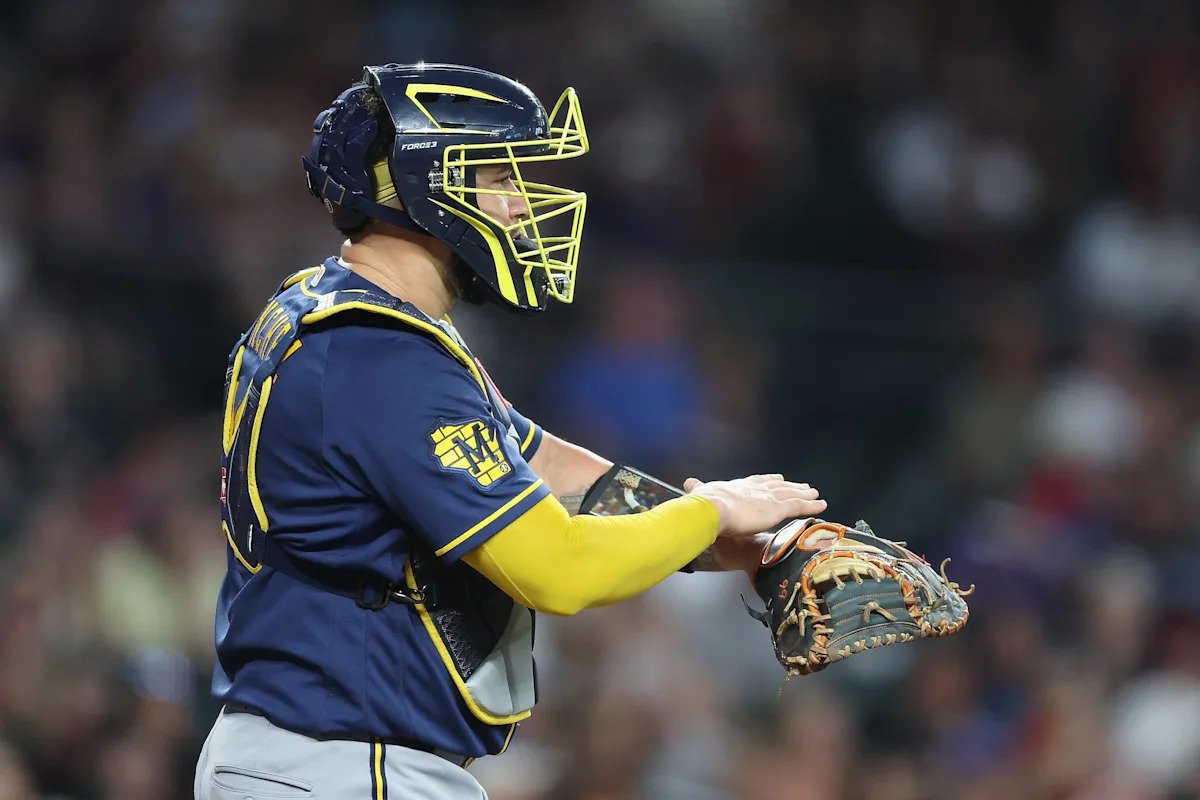
At the start of the season, the Automated Ball-Strike (ABS) challenge system was officially implemented into MLB games. This uses a full automated system based on Statcast data to challenge certain calls made by umpires. Now that we’re at the All-Star break, we have more than half a season of data to analyze about how teams are using their challenges. Let’s take a look at how the Brewers have been utilizing it.
MLB Overview
Between offense and defense, the distribution of challenges has been mostly even across MLB. There have been a total of 6,040 challenges using the ABS system so far this season. Here is the breakdown of those challenges.
Advertisement
-
2,810 challenges have been initiated by the batter. 1,345 (48%) of those were overturned.
-
3,230 challenges have been initiated by the defense (catcher or pitcher). 1,872 (58%) of those were overturned.
While this has been the average across MLB, variations within teams can be drastic. The Brewers have one of the more skewed use of challenges in their team. They have challenged 215 pitches across their 96 games. Here is their breakdown.
-
Of 66 challenges that have been initiated by the batter, 28 were overturned (42% success rate). That is the fewest number of challenges of any team in MLB. Their success rate ranks 23rd.
-
Of 149 challenges that have been initiated by the defense, 80 were overturned (54% success rate). That is the second-highest number of challenges of any team in MLB. Their success rate ranks 21st.
On a team level, the Brewers have not had the most success with challenges. They have chosen to let their catchers do the bulk of challenging, with 68.8% of their challenges made by the catcher. In fact, when it comes to the batters, one player is responsible for a significant number of batter challenges. Let’s talk about that first.
Batter Stats
First, let’s take a look at the Brewers’ challenges as a team. Here is an overview of their stats.
Advertisement
-
They have averaged 2.2 additional overturns versus the expected outcome for an average team. However, they have lost 1.9 run value versus the expected value.
-
They have had five strikeouts overturned due to challenges, last in the league. The Orioles lead this stat with 20 strikeouts overturned.
-
They have gained three additional walks from challenges, tied for second to last in the league. The Twins lead this stat with 15 additional walks.
-
Twice this season, a challenge has resulted in a strikeout on a full count being changed into a walk.
-
Their challenge rate on “challengeable” pitches is 2.7%. That is also last in the league, with the Rockies leading at 6.6%. A challengeable pitch for a batter is a called strike when the batting team has challenges remaining. (Exceptions are when a position player pitches, which is not challengeable, and if the ABS system malfunctions.)
-
Of their 66 challenges, 47 are considered “reasonable.” That 71% rate ranks seventh in MLB. Baseball Savant has a breakdown on what is considered reasonable. On a basic level, it’s either a call that is incorrect, a call that is correct but close enough and valuable enough to challenge, or a call that any player would reasonably challenge.
-
On the opposite side, they have had 355 reasonable opportunities to challenge. They have only challenged 13% of those, also last in MLB. The Astros challenge the most on reasonable opportunities, at 28%.
Now that we’ve taken a look at the overall stats for the team, let’s take a more detailed look at the individual batters.
Gary Sánchez
-
Despite being a part-time player, Sánchez has challenged the second-most pitches of any batter in MLB with 26 challenges. The leader in challenges is Sal Stewart of the Reds with 38. He also accounts for 39.4% of the challenges by batters for the Brewers.
-
Of those 26 challenges, he has won 10 and lost 16. That’s a success rate of 38%, compared to the MLB average of 48%.
-
He has a challenge rate of 17.2%, with an expected challenge rate of 4.8%. To clarify that a little further, what that means is when a pitch is challengeable, he will challenge 17.2% of the time. That is a little more than one out of every six pitches that is a called strike, while he would be expected to challenge around one out of every 20 called strikes.
-
Of his 26 challenges, only 13 (50%) have been considered reasonable. He has had 30 reasonable opportunities and challenged 43% of those.
Rest of Team
-
No other Brewers’ batter has challenged more than seven pitches. That batter is Sal Frelick, who has won two and lost five of his challenges.
-
Two batters have six challenges: Jake Bauers (three wins, three losses) and Garrett Mitchell (two wins, four losses).
-
Despite some struggles as a catcher, William Contreras has had success with his challenges as a batter. He’s challenged five pitches and won four of those.
-
For the rest of the team, no other batter has more than three challenges.
Catcher Stats
Let’s take a look at the catcher stats now. They have accounted for significantly more challenges on the team, and appear to be the focus for challenge usage.
Note: One pitcher challenge for the Brewers is included in these numbers, as they are for the fielding team as a whole and not just the catchers. That will be discussed a little more later.
-
They have averaged 9.9 fewer overturns versus the expected outcome for an average team. That is 24th in MLB. However, they have gained 3.0 run value versus the expected value, which is fourth in MLB.
-
They have added an additional 19 strikeouts from challenges, tied for eighth most in MLB. They have also eliminated six walks, tied for 12th.
-
There have been five instances where a full-count walk was flipped into a strikeout, which contributes to a significant part of their gained run value. A flipped call in this instance can easily by worth over a half run of value.
-
Of their 149 challenges, 68% of them are considered reasonable.
-
They have had 323 reasonable pitches to challenge, and have challenged 32% of those.
Let’s take a look at each of the catchers and what their rates look like.
William Contreras
-
As the primary catcher, Contreras has most of the challenges for the Brewers on defense. He has initiated 111 challenges so far this season, challenging 3.4% of challengeable pitches.
-
Not only is that the most on the Brewers, it’s the most in MLB. The second most challenges by a catcher is from Tyler Stephenson of the Reds, who has 85 challenges.
-
Of Contreras’ 111 challenges, he has won 58 and lost 53. That is a success rate of 52%, which is well below the league average of 59%. Compared to catchers with at least 10 challenges, his success rate is 60th out of 75.
-
He also has one of the lowest value ratings on those challenges. Compared to expected overturns, he has 9.2 less than an average catcher seeing the same pitches. He has also lost 3.8 runs versus the expected rate for a catcher.
-
Of his 111 challenges, 74 have been considered reasonable, which is a 67% rate. He has also had 246 reasonable opportunities and challenged 30% of those.
Gary Sánchez
-
Sánchez has had his own set of opportunities, with 35 challenges so far this season. He’s much more reasonable with his challenges as a catcher, also challenging 3.4% of challengeable pitches.
-
His success rate has been better, with 20 won and 15 lost. That is a success rate of 57%, still below MLB average but much closer to it.
-
Overall, this season, he has 0.6 less overturns than the expected rate for a catcher seeing the same pitches. He also has 1.0 runs lost versus the expected rate for a catcher.
-
Of his 35 challenges, 26 have been considered reasonable, which is a 74% rate. He has also had 70 reasonable opportunities and challenged 27% of those.
Advertisement
Jeferson Quero
-
Not to be forgotten, Quero has had a few chances as well in his very limited time, He has two challenges so far this season and won both. One of those resulted in changing a call to a strikeout.
-
Both of his challenges were considered reasonable. He has had seven reasonable opportunities and challenged two.
Pitcher Challenges
When it comes to challenges by a pitcher, these are rare. Not only is it rare for the Brewers, but it’s also rare for the league as a whole. Across the entire season so for, there have been a total of 6,040 ABS challenges. Only 109 of those have been initiated by a pitcher. So far, that has been the correct call. Of those 109 challenges, only 40 of them were overturned — a 37% success rate.
The pitcher who has initiated the most challenges is former Brewer Freddy Peralta, who has challenged six pitches and has a 50% success rate. The Brewers have a grand total of one ABS challenge initiated by a pitcher. That was done by Abner Uribe, and he lost that challenge.
Advertisement
Triple-A Stats
Baseball Savant also has tracked the stats of ABS challenges for Triple-A teams this season. The overall data is pretty similar there, but Nashville has seen more activity than the Brewers. Here’s a quick look at their numbers.
-
Batters have initiated 105 challenges. Of those, 45 were overturned (43% success rate). That is tied for the fifth-most challenges in Triple-A. Their success rate ranks 21st.
-
Catchers have initiated 128 challenges. Of those, 73 were overturned (57% success rate). That is the tied for the fourth most challenges of any team in Triple-A. Their success rate is 14th.
-
Challenges are better distributed among the Triple-A batters. Luke Adams has challenged the most pitches with 15 (eight won, seven lost). Jett Williams is second with 14 challenges (five won, nine lost).
-
It’s also an even divide between Jeferson Quero and Ramón Rodríguez for their challenges. Quero has challenged 50 pitches (31 won, 19 lost). Rodriguez has challenged 57 (35 won, 22 lost). Both have significantly more overturns then expected (15.0 for Quero, 13.3 for Rodriguez) but have a small net run loss despite that.
-
No pitchers have challenged for Nashville.
Conclusion
The Brewers have not made the best use of the ABS challenge system so far this season. Their philosophy has been focused on using challenges to get better results for their pitchers. So far, there have been growing pains with the system. They are taking their opportunities to challenge, but it hasn’t paid off the best. It’s still the first season with the system in full usage, though. Given more time, they may figure out better timing on challenges and better ways to utilize it, which will further help the team as a whole.
Advertisement
Note: All stats pulled from the Baseball Savant section of MLB.com.

